

Copyrights: Tehmina Sajid, Ropahla Aslam, Abeer Kazmi, Aleeza Kazmi, Saad farooqi, Afifa Tariq, Ali Muhammad, 2022. License: This work is licensed under a Creative Commons Attribution 4.0 International License.
Abstract
Background: Metals are required in minor amounts in the human body to perform vital functions, but beyond that level, they become toxic and cause many harmful effects. At present, polluted water is a large source of these heavy metals inside our body. Bioremediation is one of best treatments for the removal of these heavy metals from water. Objectives: The main objective of the current study was to isolate metal-reducing bacteria from soil and wastewater samples from different industries. Furthermore, the metal reducing potential of the bacteria was also evaluated under various environmental conditions (pH, temperature, incubation time, and UV exposure).
Methodology: Different bacterial strains were isolated that were resistant to different concentrations of zinc (Zn) and chromium (Cr) from wastewater and soil samples from four different industries (Riaz textile mills, Sitara chemical industry, Mandiali paper mills and Siddique leather works). Morphological characterization was carried out with the help of Gram staining, spore staining and motility tests. Biochemical tests were performed, such as catalase, oxidase, and H2S production tests, starch hydrolysis tests and Simon citrate tests. Chromium reduction after UV exposure was calculated to check mutation effects on chromium reduction.
Results: A total of 14 bacterial strains were isolated from the soil and wastewater samples. Six strains were Zn resistant, while eight strains were chromium resistant. A total of five strains were isolated from wastewater out of fourteen strains, while the remaining nine strains were isolated from soil samples of these industries. The bacterial strains were rod-shaped cocci and coccobacillus. The growth of bacterial strains under different environmental conditions, such as temperature, pH and incubation time, was observed, and the best growth was found at 37â—¦C, pH 7.0 and after 48 hrs. Maximum reduction at different concentrations was observed at pH 7.0 and 37â—¦C and after 48 hrs.
Conclusion: In conclusion, the bacterial strains isolated from industrial wastes and soils showed significant resistivity against various concentrations of Zn and Cr and reduced it efficiently under different conditions (pH, incubation time, temperature and UV light). The use of microorganisms for bioremediation is an environmentally friendly and cost-effective approach to reduce heavy metals present in our water and soil.
INTRODUCTION
Heavy metals are defined as metals with a particular density greater than 5 g/cm3 that have a negative impact on the environment and living beings. When present in extremely low quantities, these metals are important for maintaining different biochemical and physiological processes in living organisms; nevertheless, when concentrations surpass specific thresholds, they become toxic 1, 2. Heavy metals are emitted by natural and anthropogenic activities into the environment. Most heavy metals reach the environment from mining operations3. Heavy metals also persist in the environment even when mining activities are stopped. This was due to anthropogenic activities such as different foods, cosmetics and other chemicals that we used in our routines contain heavy metals 4. Heavy metals are present in the waste of many industries, such as the tanning, textile and electroplating industries5. When added to other water resources, including drinking water, their wastewater becomes a cause of toxicity 6. Water contaminated with these heavy metals when applied to agricultural areas enters into food crops through the water uptake of plants7. Due to their nonbiodegradable nature, heavy metals enter the food chain and affect living species8. When we consume food with heavy metals, they enter the human body and affect bodily functions, causing disease depending upon the metal. The most frequent heavy metals detected in waste water are arsenic, cadmium, chromium, copper, lead, nickel, and zinc, all of which pose health and environmental hazards9.
Chromium pollution of the environment, specifically hexavalent chromium pollution, has been a major problem in recent years10. Cr(III) is oxidized to Cr(VI) in the presence of sufficient oxygen in the environment, which is incredibly poisonous and readily soluble in water11. Excess chromium in the environment is harmful to plants because it alters the biological components of the plant and enters the food chain via the ingestion of these plant materials7, 12. Reduced root development, leaf chlorosis, germination rate inhibition, and low biomass are all common symptoms of Cr phytotoxicity13, 14, 15. Chromium (VI) has corrosive properties and can induce allergic responses in the body. As a result, inhaling excessive quantities of chromium (VI) can irritate the nasal lining and lead to nose ulcers16. It can also harm sperm and the male reproductive system17, causing anemia18, irritations, and ulcers in the small intestine and stomach19. Chromium also induces allergic responses, including significant skin redness and edema20. Humans may have serious cardiovascular, pulmonary, hematological, gastrointestinal, renal, hepatic, and neurological consequences, as well as mortality, when exposed to excessively high concentrations of chromium(VI) compounds16, 21, 22.
Several technologies have been developed for the treatment of water containing heavy metals and other waste. Different synthetic compounds are used to treat such waste types, but they are too expensive. One and only effective and cost-effective method is the biodegradation of heavy metals from bacteria. The main objective of the current study was to isolate these bacteria from soil and wastewater samples from different industries, including the leather industry, paper mill, chemical industry and textile industry, which have the potential to reduce and degrade chromium (Cr) at different temperatures, pH values and incubation times. For bacterial characterization, different morphological, biochemical and physiological tests were also performed. The effect of DNA mutation on chromium reduction was also observed after exposure to UV.
METHODOLOGY
Sample collection
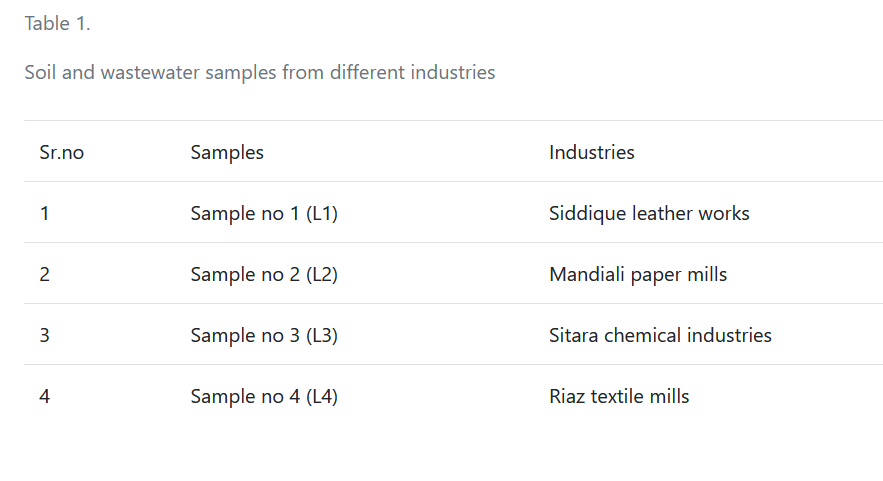
Samples were collected from different industries, including Siddique leather works, Mandiali paper mills, Sitara chemical industry and Riaz textile mills. Waste water and soil samples of these four industries were collected by using a bottle following safety precautions. These samples were stored in properly labeled bottles. These samples were stored under proper conditions before laboratory experiments to avoid reactions (Table 1).
| Sr.no | Samples | Industries |
| 1 | Sample no 1 (L1) | Siddique leather works |
| 2 | Sample no 2 (L2) | Mandiali paper mills |
| 3 | Sample no 3 (L3) | Sitara chemical industries |
| 4 | Sample no 4 (L4) | Riaz textile mills |
| Sr.no | Strains | Samples |
| 1 | S 1 ZnL 1 | Soil sample of Siddique leather works |
| 2 | S 2 ZnL 1 | Soil sample of Siddique leather works |
| 3 | S 3 ZnL 1 | Soil sample of Siddique leather works |
| 4 | S 4 ZnL 1 | Soil sample of Siddique leather works |
| 5 | S 5 ZnL 3 | Soil sample of Sitara chemical industries |
| 6 | W 1 ZnL 1 | Water sample of Siddique leather works |
| 7 | S 2 CrL 2 (A) | Soil sample of Mandiali paper mills |
| 8 | S 2 CrL 2 (B) | Soil sample of Mandiali paper mills |
| 9 | W 1 CrL 3 (A) | Water sample of sitara chemical industries |
| 10 | W 1 CrL 3 (B) | Water sample of sitara chemical industries |
| 11 | S 4 CrL 4 | Soil sample of Riaz textile mills |
| 12 | W 4 CrL 4 | Water sample of Riaz textile mills |
| 13 | W 3 CrL 2 | Water sample of Mandiali paper mills |
| 14 | S 5 CrL 1 | Soil sample of Siddique textile mills |
| Sr.no | Strains | Colony morphology | ||||||
| Size | Form | Pigment | Margin | Elevation | Texture | Opacity | ||
| 1 | S 1 ZnL 1 | Large | Circular | Cream | Entire | Convex | Mucoid | Non- opaque |
| 2 | S 2 ZnL 1 | Medium | Irregular | Off white | Entire | Umbonate | Shiny | Opaque |
| 3 | S 3 ZnL 1 | Medium | Circular | Off white | Entire | Flat | Shiny | Non- opaque |
| 4 | S 4 ZnL 1 | Medium | Circular | Yellow | Entire | Flat | Shiny | Non- opaque |
| 5 | S 5 ZnL 3 | Large | Circular | Cream | Entire | Raised | Mucoid | Non- opaque |
| 6 | W 1 ZnL 1 | Large | Circular | Off white | Entire | Flat | Shiny | Non- opaque |
| 7 | S 2 CrL 2 (A) | Medium | Circular | Cream | Entire | Raised | Mucoid | Non- opaque |
| 8 | S 2 CrL 2 (B) | Small | Irregular | White | Lobate | Umbonate | Rough | Non- opaque |
| 9 | W 1 CrL 3 (A) | Medium | Circular | White | Entire | Flat | Mucoid | Non- opaque |
| 10 | W 1 CrL 3 (B) | Medium | Circular | Off white | Entire | Flat | Mucoid | Non- opaque |
| 11 | S 4 CrL 4 | Small | Circular | Cream | Entire | Convex | Mucoid | Non- opaque |
| 12 | W 4 CrL 4 | Small | Circular | Yellow | Entire | Umbonate | Shiny | Opaque |
| 13 | W 3 CrL 2 | Medium | Circular | Off white | Entire | Flat | Mucoid | Non- opaque |
| 14 | S 5 CrL 1 | Large | Rhizoid | White | Filifom | crateriform | Rough | Non- opaque |
| Sr.no | Strains | Cell shape | Gram Staining | Spore formation | Motility |
| 1 | S 1 ZnL 1 | Coccus | + | + | - |
| 2 | S 2 ZnL 1 | Rod | + | + | - |
| 3 | S 3 ZnL 1 | Rod | - | + | - |
| 4 | S 4 ZnL 1 | Coccus | + | + | - |
| 5 | S 5 ZnL 3 | Coccobacilli | + | + | - |
| 6 | W 1 ZnL 1 | Rod | + | + | - |
| 7 | S 2 CrL 2 (A) | Rod | + | + | - |
| 8 | S 2 CrL 2 (B) | Coccus | + | + | - |
| 9 | W 1 CrL 3 (A) | Coccus | + | + | - |
| 10 | W 1 CrL 3 (B) | Coccus | + | + | - |
| 11 | S 4 CrL 4 | Coccobacilli | + | + | - |
| 12 | W 4 CrL 4 | Rod | + | + | - |
| 13 | W 3 CrL 2 | Rod | + | + | - |
| 14 | S 5 CrL 1 | Rod | - | + | - |
| Sr.no | Strains | Catalase | Oxidase | Indole test | H2S production test | Starch Hydrolysis test |
| 1 | S 1 ZnL 1 | + | + | - | - | - |
| 2 | S 2 ZnL 1 | + | + | - | - | - |
| 3 | S 3 ZnL 1 | + | + | - | - | - |
| 4 | S 4 ZnL 1 | + | + | - | - | + |
| 5 | S 5 ZnL3 | + | + | - | - | + |
| 6 | W 1 ZnL 1 | + | + | - | - | + |
| 7 | S 2 CrL 2 (A) | + | + | - | - | - |
| 8 | S 2 CrL 2 (B) | + | + | - | - | + |
| 9 | W 1 CrL 3 (A) | + | + | - | - | + |
| 10 | W 1 CrL 3 (B) | + | + | - | - | - |
| 11 | S 4 CrL 4 | + | + | - | - | + |
| 12 | W 4 CrL 4 | + | + | - | - | + |
| 13 | W 3 CrL 2 | + | + | - | - | - |
| 14 | S 5 CrL 1 | + | + | - | - | - |
| Sr no | Strains | Cross Metal resistance at 100µl concentration | ||||||
| Zinc (Zn) | Chromium (Cr) | Cobalt (Co) | Manganese (Mn) | Nickle (Ni) | Silicon (Si) | Selenium (Se) | ||
| 1 | S 1 ZnL 1 | o | o | o | o | o | × | o |
| 2 | S 2 ZnL 1 | o | o | o | o | o | × | o |
| 3 | S 3 ZnL 1 | o | × | o | o | o | × | o |
| 4 | S 4 ZnL 1 | o | o | o | o | o | o | o |
| 5 | S 5 ZnL 3 | o | o | o | o | o | × | o |
| 6 | W 1 ZnL 1 | o | o | o | o | o | o | o |
| 7 | S 2 CrL 2 (A) | o | o | o | o | o | × | o |
| 8 | S 2 CrL 2 (B) | × | o | o | o | o | o | o |
| 9 | W 1 CrL 3 (A) | o | o | × | o | o | × | o |
| 10 | W 1 CrL 3 (B) | o | o | × | o | o | o | o |
| 11 | S 4 CrL 4 | o | o | o | o | o | × | o |
| 12 | W 4 CrL 4 | o | o | o | o | o | × | o |
| 13 | W 3 CrL 2 | o | o | o | o | o | × | o |
| 14 | S 5 CrL 1 | o | o | × | o | o | o | o |
| Sr no | Strains | Cross Metal resistance at 150µl concentration | ||||||
| Zinc (Zn) | Chromium (Cr) | Cobalt (Co) | Manganese (Mn) | Nickle (Ni) | Silicon (Si) | Selenium (Se) | ||
| 1 | S 1 ZnL 1 | o | o | o | o | o | × | o |
| 2 | S 2 ZnL 1 | o | o | o | o | o | × | o |
| 3 | S 3 ZnL 1 | o | × | o | o | o | × | o |
| 4 | S 4 ZnL 1 | o | o | o | o | o | o | o |
| 5 | S 5 ZnL 3 | o | o | o | o | o | × | o |
| 6 | W 1 ZnL 1 | o | × | o | o | o | o | o |
| 7 | S 2 CrL 2 (A) | o | o | o | o | o | × | o |
| 8 | S 2 CrL 2 (B) | × | o | o | o | o | × | o |
| 9 | W 1 CrL 3 (A) | o | o | × | o | o | × | o |
| 10 | W 1 CrL 3 (B) | o | o | × | o | o | × | o |
| 11 | S 4 CrL 4 | o | o | × | o | o | × | o |
| 12 | W 4 CrL 4 | o | o | o | o | o | × | o |
| 13 | W 3 CrL 2 | o | o | o | o | o | × | o |
| 14 | S 5 CrL 1 | × | o | × | o | o | o | o |
| Sr.n o | Strains | Cross Metal resistance at 200µl concentration | ||||||
| Zinc (Zn) | Chromium (Cr) | Cobalt (Co) | Manganese (Mn) | Nickle (Ni) | Silicon (Si) | Selenium(Se) | ||
| 1 | S1ZnL1 | o | o | o | o | o | × | o |
| 2 | S2ZnL1 | o | o | o | o | o | × | o |
| 3 | S3ZnL1 | o | × | o | o | × | × | o |
| 4 | S4ZnL1 | o | o | o | o | o | o | o |
| 5 | S5ZnL3 | o | o | × | o | o | × | o |
| 6 | W1ZnL1 | o | × | o | o | o | o | o |
| 7 | S2CrL2 (A) | o | o | o | o | o | × | o |
| 8 | S2CrL2 (B) | × | o | o | o | o | × | o |
| 9 | W1CrL3 (A) | o | o | × | o | o | × | o |
| 10 | W1CrL3 (B) | × | o | × | o | × | × | o |
| 11 | S4CrL4 | × | o | × | o | o | × | o |
| 12 | W4CrL4 | o | o | o | o | o | × | o |
| 13 | W3CrL2 | × | o | o | o | o | × | o |
| 14 | S5CrL1 | × | o | × | o | × | o | o |
| Sr no | Strains | Cross Metal resistance at 300µl concentration | ||||||
| Zinc (Zn) | Chromium (Cr) | Cobalt (Co) | Manganese (Mn) | Nickle (Ni) | Silicon (Si) | Selenium (Se) | ||
| 1 | S 1 ZnL 1 | o | o | o | o | × | × | o |
| 2 | S 2 ZnL 1 | o | o | o | o | × | × | o |
| 3 | S 3 ZnL 1 | o | × | o | o | × | × | o |
| 4 | S 4 ZnL 1 | o | o | o | o | × | o | o |
| 5 | S 5 ZnL 3 | o | o | × | o | × | × | o |
| 6 | W 1 ZnL 1 | o | × | o | × | × | o | o |
| 7 | S 2 CrL 2 (A) | o | o | o | o | × | × | o |
| 8 | S 2 CrL 2 (B) | × | o | o | o | × | × | o |
| 9 | W 1 CrL 3 (A) | × | o | × | o | × | × | o |
| 10 | W 1 CrL 3 (B) | × | o | × | o | × | × | o |
| 11 | S 4 CrL 4 | × | o | × | o | o | × | o |
| 12 | W 4 CrL 4 | o | o | o | o | × | × | o |
| 13 | W 3 CrL 2 | × | o | o | o | × | × | o |
| 14 | S 5 CrL 1 | × | o | × | o | × | o | o |
| Sr. no | Strains | Time (hours) | |||||
| 2 | 4 | 6 | 18 | 24 | 48 | ||
| 1 | S 1 ZnL 1 | 0.041 | 0.472 | 0.561 | 1.89 | 1.989 | 2.000 |
| 2 | S 2 ZnL 1 | 0.058 | 0.530 | 0.676 | 1.213 | 1.24 | 0.949 |
| 3 | S 3 ZnL 1 | 0.031 | 0.452 | 0.613 | 0.921 | 1.924 | 1.543 |
| 4 | S 4 ZnL 1 | 0.059 | 0.563 | 0.721 | 0.986 | 1.014 | 1.986 |
| 5 | S 5 ZnL 3 | 0.050 | 0.439 | 0.689 | 0.890 | 0.909 | 1.893 |
| 6 | W 1 ZnL 1 | 0.030 | 0.621 | 0.798 | 0.940 | 0.953 | 1.923 |
| 7 | S 2 CrL 2 (A) | 0.073 | 0.534 | 0.890 | 1.231 | 1.240 | 2.100 |
| 8 | S 2 CrL 2 (B) | 0.045 | 0.567 | 0.888 | 0.987 | 0.990 | 1.712 |
| 9 | W 1 CrL 3 (A) | 0.035 | 0.478 | 0.650 | 0.989 | 1.001 | 1.754 |
| 10 | W 1 CrL 3 (B) | 0.023 | 0.211 | 0.567 | 0.811 | 0.813 | 1.432 |
| 11 | S 4 CrL 4 | 0.041 | 0.314 | 0.659 | 0.989 | 0.990 | 1.976 |
| 12 | W 4 CrL 4 | 0.121 | 0.362 | 0.789 | 0.912 | 0.930 | 2.213 |
| 13 | W 3 CrL 2 | 0.090 | 0.450 | 0.889 | 0.995 | 0.100 | 2.221 |
| 14 | S 5 CrL 1 | 0.061 | 0.313 | 0.540 | 0.777 | 0.780 | 1.653 |
| Sr. no | Strains | Optical Density at Different Ph (O.D) | ||
| 3 | 5 | 9 | ||
| 1 | S 1 ZnL 1 | 0.412 | 1.226 | 0.728 |
| 2 | S 2 ZnL 1 | 0.451 | 1.162 | 0.577 |
| 3 | S 3 ZnL 1 | 0.460 | 0.944 | 0.633 |
| 4 | S 4 ZnL 1 | 0.409 | 1.200 | 0.409 |
| 5 | S 5 ZnL 3 | 0.375 | 1.052 | 0.721 |
| 6 | W 1 ZnL 1 | 0.286 | 0.796 | 1.100 |
| 7 | S 2 CrL 2 (A) | 0.688 | 1.209 | 0.488 |
| 8 | S 2 CrL 2 (B) | 0.241 | 0.472 | 0.644 |
| 9 | W 1 CrL 3 (A) | 0.245 | 0.312 | 0.503 |
| 10 | W 1 CrL 3 (B) | 0.441 | 1.078 | 0.618 |
| 11 | S 4 CrL 4 | 0.406 | 0.671 | 0.204 |
| 12 | W 4 CrL 4 | 0.280 | 0.521 | 0.423 |
| 13 | W 3 CrL 2 | 0.277 | 0.705 | 0.570 |
| 14 | S 5 CrL 1 | 0.185 | 1.179 | 0.223 |
| Sr. no | Strains | Optical Density at Different Temperatures (O.D) | |||
| 27 o C | 37 o C | 20 o C | 42 o C | ||
| 1 | S 1 ZnL 1 | 0.22 | 0.752 | 0.466 | 0.604 |
| 2 | S 2 ZnL 1 | 0.946 | 0.637 | 0.303 | 0.412 |
| 3 | S 3 ZnL 1 | 1.808 | 0.616 | 0.316 | 1.109 |
| 4 | S 4 ZnL 1 | 0.191 | 1.522 | 0.456 | 0.709 |
| 5 | S 5 ZnL 3 | 1.602 | 1.368 | 0.535 | 0.654 |
| 6 | W 1 ZnL 1 | 0.671 | 1.098 | 0.589 | 0.809 |
| 7 | S 2 CrL 2 (A) | 0.954 | 1.140 | 0.649 | 0.840 |
| 8 | S 2 CrL 2 (B) | 0.507 | 0.883 | 0.439 | 0.228 |
| 9 | W 1 CrL 3 (A) | 0.610 | 1.218 | 0.283 | 0.246 |
| 10 | W 1 CrL 3 (B) | 0.482 | 1.370 | 0.375 | 1.062 |
| 11 | S 4 CrL 4 | 0.201 | 1.368 | 0.322 | 0.267 |
| 12 | W 4 CrL 4 | 0.747 | 1.848 | 0.300 | 0.364 |
| 13 | W 3 CrL 2 | 0.588 | 1.694 | 0.297 | 0.367 |
| 14 | S 5 CrL 1 | 0.279 | 0.980 | 0.329 | 0.255 |
| Sr. no | Strains | Optical Density at Different incubation time at 37oC (O.D) | ||
| 24hrs | 48hrs | 72hrs | ||
| 1 | S 1 ZnL 1 | 0.752 | 1.011 | 1.272 |
| 2 | S 2 ZnL 1 | 0.637 | 0.926 | 1.110 |
| 3 | S 3 ZnL 1 | 0.616 | 0.879 | 1.314 |
| 4 | S 4 ZnL 1 | 1.522 | 1.721 | 1.897 |
| 5 | S 5 ZnL 3 | 1.368 | 1.509 | 1.627 |
| 6 | W 1 ZnL 1 | 1.098 | 1.143 | 1.204 |
| 7 | S 2 CrL 2 (A) | 1.140 | 1.532 | 1.619 |
| 8 | S 2 CrL 2 (B) | 0.883 | 1.090 | 1.213 |
| 9 | W 1 CrL 3 (A) | 1.218 | 1.322 | 1.430 |
| 10 | W 1 CrL 3 (B) | 1.370 | 1.520 | 1.790 |
| 11 | S 4 CrL 4 | 1.368 | 1.546 | 1.620 |
| 12 | W 4 CrL 4 | 1.848 | 1.982 | 2.120 |
| 13 | W 3 CrL 2 | 1.694 | 1.720 | 1.910 |
| 14 | S 5 CrL 1 | 0.980 | 1.112 | 1.329 |
| Sr. no | Strains | % of chromium reduction(100µl)at different temperature | ||
| 37 o C | 27 o C | 25 o C | ||
| 1 | S 2 CrL 2 (A) | 84 | 67 | 54 |
| 2 | S 2 CrL 2 (B) | 75 | 56 | 47 |
| 3 | W 1 CrL 3 (A) | 89 | 72 | 61 |
| 4 | W 1 CrL 3 (B) | 88 | 51 | 47 |
| 5 | S 4 CrL 4 | 90 | 60 | 59 |
| 6 | W 4 CrL 4 | 90 | 77 | 60 |
| 7 | W 3 CrL 2 | 93 | 73 | 61 |
| 8 | S 5 CrL 1 | 86 | 60 | 43 |
| Sr. no | Strains | % of chromium reduction(150µl) at different temperature | ||
| 37 o C | 27 o C | 25 o C | ||
| 1 | S 2 CrL 2 (A) | 77 | 67 | 54 |
| 2 | S 2 CrL 2 (B) | 72 | 68 | 50 |
| 3 | W 1 CrL 3 (A) | 76 | 69 | 42 |
| 4 | W 1 CrL 3 (B) | 79 | 75 | 70 |
| 5 | S 4 CrL 4 | 81 | 79 | 65 |
| 6 | W 4 CrL 4 | 83 | 76 | 59 |
| 7 | W 3 CrL 2 | 74 | 68 | 67 |
| 8 | S 5 CrL 1 | 82 | 75 | 72 |
| Sr. no | Strains | % of chromium reduction(100µl) at different pH | ||
| 5 | 7 | 9 | ||
| 1 | S 2 CrL 2 (A) | 89 | 81 | 61 |
| 2 | S 2 CrL 2 (B) | 67 | 79 | 73 |
| 3 | W 1 CrL 3 (A) | 87 | 93 | 74 |
| 4 | W 1 CrL 3 (B) | 84 | 78 | 56 |
| 5 | S 4 CrL 4 | 59 | 91 | 61 |
| 6 | W 4 CrL 4 | 64 | 88 | 65 |
| 7 | W 3 CrL 2 | 55 | 83 | 80 |
| 8 | S 5 CrL 1 | 62 | 87 | 65 |
| Sr. no | Strains | % of chromium reduction(150µl)at different pH | ||
| 5 | 7 | 9 | ||
| 1 | S 2 CrL 2 (A) | 81 | 80 | 64 |
| 2 | S 2 CrL 2 (B) | 55 | 71 | 60 |
| 3 | W 1 CrL 3 (A) | 83 | 82 | 65 |
| 4 | W 1 CrL 3 (B) | 81 | 71 | 67 |
| 5 | S 4 CrL 4 | 57 | 83 | 70 |
| 6 | W 4 CrL 4 | 53 | 81 | 69 |
| 7 | W 3 CrL 2 | 54 | 80 | 73 |
| 8 | S 5 CrL 1 | 60 | 74 | 65 |
| Sr. no | Strains | % of chromium reduction (100µl) at 37oC at different incubation time | ||
| 24hrs | 48hrs | 72hrs | ||
| 1 | S 2 CrL 2 (A) | 66 | 72 | 76 |
| 2 | S 2 CrL 2 (B) | 61 | 68 | 71 |
| 3 | W 1 CrL 3 (A) | 56 | 67 | 75 |
| 4 | W 1 CrL 3 (B) | 67 | 79 | 87 |
| 5 | S 4 CrL 4 | 56 | 68 | 79 |
| 6 | W 4 CrL 4 | 64 | 84 | 89 |
| 7 | W 3 CrL 2 | 78 | 86 | 93 |
| 8 | S 5 CrL 1 | 65 | 74 | 83 |
| Sr. no | Strains | % of chromium reduction (150µl) at 37oC at different incubation time | ||
| 24hrs | 48hrs | 72hrs | ||
| 1 | S 2 CrL 2 (A) | 55 | 69 | 74 |
| 2 | S 2 CrL 2 (B) | 50 | 62 | 68 |
| 3 | W 1 CrL 3 (A) | 65 | 70 | 73 |
| 4 | W 1 CrL 3 (B) | 68 | 74 | 80 |
| 5 | S 4 CrL 4 | 60 | 67 | 71 |
| 6 | W 4 CrL 4 | 80 | 82 | 85 |
| 7 | W 3 CrL 2 | 76 | 87 | 91 |
| 8 | S 5 CrL 1 | 57 | 67 | 72 |
| Sr. no | Strains | % of Chromium reduction(100µl) at 37 o C after UV exposure | |
| Without UV | With UV | ||
| 1 | S 2 CrL 2 (A) | 66 | 13 |
| 2 | S 2 CrL 2 (B) | 61 | 93 |
| 3 | W 1 CrL 3 (A) | 56 | 92 |
| 4 | W 1 CrL 3 (B) | 67 | 94 |
| 5 | S 4 CrL 4 | 56 | 95 |
| 6 | W 4 CrL 4 | 64 | 94 |
| 7 | W 3 CrL 2 | 78 | 91 |
| 8 | S 5 CrL 1 | 65 | 93 |
| Sr. no | Strains | % of Chromium reduction (150µl) at 37 o C after UV exposure | |
| Without UV | With UV | ||
| 1 | S 2 CrL 2 (A) | 55 | 11 |
| 2 | S 2 CrL 2 (B) | 50 | 10 |
| 3 | W 1 CrL 3 (A) | 65 | 97 |
| 4 | W 1 CrL 3 (B) | 68 | 13 |
| 5 | S 4 CrL 4 | 60 | 16 |
| 6 | W 4 CrL 4 | 80 | 94 |
| 7 | W 3 CrL 2 | 76 | 12 |
| 8 | S 5 CrL 1 | 57 | 14 |
| Sr. no | Strains | % of Chromium reduction (100µl) after 48 hrs | |
| Without UV | With UV | ||
| 1 | S 2 CrL 2 (A) | 91 | 24 |
| 2 | S 2 CrL 2 (B) | 13 | 81 |
| 3 | W 1 CrL 3 (A) | 37 | 84 |
| 4 | W 1 CrL 3 (B) | 12 | 87 |
| 5 | S 4 CrL 4 | 13 | 83 |
| 6 | W 4 CrL 4 | 26 | 71 |
| 7 | W 3 CrL 2 | 13 | 86 |
| 8 | S 5 CrL 1 | 12 | 89 |
| Sr. no | Strains | % of Chromium reduction (150µl) after 48hrs | |
| Without UV | With UV | ||
| 1 | S 2 CrL 2 (A) | 79 | 85 |
| 2 | S 2 CrL 2 (B) | 63 | 84 |
| 3 | W 1 CrL 3 (A) | 61 | 78 |
| 4 | W 1 CrL 3 (B) | 61 | 84 |
| 5 | S 4 CrL 4 | 64 | 85 |
| 6 | W 4 CrL 4 | 63 | 83 |
| 7 | W 3 CrL 2 | 71 | 81 |
| 8 | S 5 CrL 1 | 68 | 71 |
| Sr. no | Strains | % of Chromium reduction (100µl) at PH 7 at 37 o C after UV exposure | |
| Without UV | With UV | ||
| 1 | S 2 CrL 2 (A) | 89 | 31 |
| 2 | S 2 CrL 2 (B) | 55 | 89 |
| 3 | W 1 CrL 3 (A) | 71 | 86 |
| 4 | W 1 CrL 3 (B) | 73 | 92 |
| 5 | S 4 CrL 4 | 67 | 93 |
| 6 | W 4 CrL 4 | 72 | 77 |
| 7 | W 3 CrL 2 | 74 | 81 |
| 8 | S 5 CrL 1 | 89 | 96 |
| Sr. no | Strains | % Chromium reduction (150µl) at PH 7 at 37 o C after UV exposure | |
| Without UV | With UV | ||
| 1 | S 2 CrL 2 (A) | 71 | 93 |
| 2 | S 2 CrL 2 (B) | 65 | 80 |
| 3 | W 1 CrL 3 (A) | 73 | 84 |
| 4 | W 1 CrL 3 (B) | 74 | 91 |
| 5 | S 4 CrL 4 | 87 | 95 |
| 6 | W 4 CrL 4 | 72 | 79 |
| 7 | W 3 CrL 2 | 79 | 83 |
| 8 | S 5 CrL 1 | 78 | 90 |
Isolation of metal - resistant bacteria
Metals, including zinc and chromium 1% stock solutions, were prepared in autoclaved distilled water under sterile conditions. Dilution series of all water and soil samples were made up to 103. Pouring of these samples (Dilution 3) on L-Agar media with a metal salt concentration (ZnCl2, K2CrO4) of 100 µl was performed under sterile conditions in a laminar flow cabinet. These Petri dishes were placed in an incubator for 24 hours at 37°C. The culture was observed after a one-day incubation.
Morphological characterization
Colony morphology
Isolated colonies of bacterial strains were obtained after 24 hrs of incubation. Colonies on the basis of their different physical appearances were selected and streaked on L-agar plates. These plates were placed in an incubator at 37°C for 24 hrs. After isolation, the shape, size, color and margins of the strains were observed.
Cell morphology
Gram staining
In gram staining, a simple glass slide is used. A drop of distilled water was placed on a glass slide, and a smear was made of a 24-hr-old bacterial culture with the help of a sterile loop. Smear was air dried and heat fixed after spreading the smear. First, crystal violet was used to cover the smear for 60 seconds. It was washed with distilled water after 60 sec. Iodine solution was used to cover this smear after washing with water for 45 sec. Again, the smear was washed with distilled water and dipped into alcohol (95%) for the removal of extra stain. Secondary dye (Safranin) was applied for 1 min and washed with distilled water. These slides were observed under a microscope after oil immersion.
Spore staining
For spore staining, a drop of distilled water was placed on a glass slide with a sterile loop. A bacterial culture, which was 5 days old, was placed on this drop, and a smear was made with a sterile loop. This smear was air dried and heat fixed. Smear was submerged in malachite green (aqueous 0.5%) and heated on steam for 10 min. The slide was washed with distilled water to eliminate extra stain. Smear was again submerged in safranin for 30 sec. The samples were again washed with water and observed under a microscope with immersion oil.
Biochemical characterization
Catalase test
This test was used to determine the production of catalase enzyme. Catalase enzyme catalases oxygen from hydrogen peroxide and is used to differentiate catalase-producing bacteria (staphylococci) from noncatalase-producing bacteria (streptococci). In brief, hydrogen peroxide solution drops were placed on a glass slide, a loop full of bacterial culture was placed on this drop, and a smear was made. The appearance of white bubbles showed positive results.
Oxidase test
This test is used to check the presence of oxidase enzyme in bacteria. Tetramethylene diamine, a red dye, is reduced to purple by the oxidase enzyme. The filter paper was moisturized with a 1% solution of tetramethyl-p-pHenylene diamine. Fresh cultures (24-48 hours) of different bacterial strains were smeared with the help of a sterilized platinum loop. Purple color appearance is on smearing of bacterial culture showed positive results and vice versa.
Motility Test
This test was performed to check bacterial motility that either is motile or nonmotile. Nonmotile bacteria grow along a straight line in a tube, while motile bacteria not only grow along a straight line but also spread. In the current study, SIM agar was poured into test tubes and autoclaved. The bacterial culture was stabbed with the help of a sterilized loop. These test tubes were incubated for 48 hours in an incubator at 37°C. After 48 hrs, the bacterial motility pattern was checked.
Starch hydrolysis test
Initially, bacteria were isolated on L agar plates supplemented with 0.2% starch. Strains were stabbed on these plates and placed in an incubator for 24 hours at 37°C. After 24 hours of incubation, strains were flooded with iodine solution. Clear zones around some bacterial strains appeared, which showed that strains were starch positive, while others were starch negative.
H2S production test
Some bacteria can breakdown amino acids that consist of sulfur. They reduce inorganic sulfur compounds and produce H2S. To determine H2S production in isolated strains, Sim agar medium was prepared, poured into test tubes and autoclaved. These test tubes were inoculated with fresh bacterial culture (24-48 hrs) except for the control. These tubes were placed in an incubator for 24 hours at 37°C. The appearance of a black medium indicated positive results.
Arginine hydrolysis test
Bacteria can hydrolyze arginine under anaerobic conditions. Arginine broth was prepared, poured and autoclaved. It was poured into test tubes that were inoculated with fresh bacterial culture. Paraffin oil (1 ml) was poured into each test tube before incubation, including the control, to make the conditions anaerobic. These test tubes were placed in an incubator at 37°C for 24-48 hrs. The pink color of the medium indicates positive results.
Physiological characterization
Growth at different pH values
This test was performed to check bacterial strain survival in acidic, basic and optimum environments. L-broth was prepared, and its pH was maintained at 3, 5 and 9. This medium was poured into test tubes. These test tubes were autoclaved at 121°C at 15 psi for 15 minutes. The bacterial culture was inoculated with the help of a sterilized loop. Test tubes were incubated for 24-48 hours in an incubator at 37°C. After incubation, O. of all bacterial strains at different pH values was measured, which determined bacterial survival in acidic and basic media.
Growth at different temperatures
Bacterial growth at different temperatures was checked to determine bacterial survival at high and low temperatures and to determine the optimum temperature for maximum bacterial growth. L-Broth was prepared and poured into test tubes. These test tubes were autoclaved. These test tubes were inoculated with bacterial culture and placed in different incubators at different temperatures, including 37°C, 27°C, 30°C and 25°C, for 24 hours. O. D was measured for these strains at different temperatures by spectrophotometry at 540 nm. This O. D shows bacterial resistance to different temperatures and optimum temperatures at which maximum growth was obtained.
Growth at different incubation times
Bacterial growth at different incubation times was checked to determine the optimum incubation time at which maximum growth occurs. This broth was inoculated with strains and placed in an incubator at 37°C after 24 hrs, 48 hrs and 72 hrs. After 24 hrs, the optical density (O. of all strains were measured by spectrophotometry at 540 nm. The optical density of the strains was also determined after 48 hrs and 72 hrs.
Growth curve
Bacterial life phases, such as the stationary phase, lag phase, log phase and declining phase, could be described by growth curves with respect to time. These phases could be determined by plotting this graph. L-Broth was prepared and poured into test tubes to determine growth after different time intervals. These test tubes were autoclaved and inoculated with bacterial culture. These test tubes were placed in an incubator at 37°C for 24 hours, and O. D of all strains was calculated after different time intervals of 2, 4, 6, 18, 24 and 48 hours to check bacterial growth.
Metal resistance test
Bacterial resistance against different metals, including lead (Pb), nickel (Ni), zinc (Zn), mercury (Hg), chromium (Cr), cobalt (Co), silver (Si) and manganese (Mn), was checked. L- agar media was prepared and autoclaved. Stock solutions of different salts were prepared by mixing 1 g of each salt in 100 ml of autoclaved water. Before pouring, different salt concentrations, including ZnCl2, k2CrO4, HgCl2, MnSO4, NiCl2, CoCl2, and SiCl2, with different concentrations (100 µl, 150 µl, 200 µl, 250 µl, 300 µl) were prepared. Strains were streaked against different metal concentrations. These plates were incubated for 24 hours at 37°C°C. The appearance of bacterial strains showed positive results.
Chromium reduction under different conditions
Chromium reduction at different temperatures
Potassium dichromate reduction was checked at different temperatures (27°C, 37°C, 25°C). L-broth was supplemented with K2Cr2O7 (100 µl, 150 µl). Each test tube with 5 ml media was inoculated and placed in an incubator for 24 hours. After incubation, 2 µl of culture media was transferred into autoclaved Eppendorf tubes. These Eppendorf tubes were centrifuged at 6000 rpm for 15 minutes. Pellets were settled down after centrifugation. One hundred microliters of suspension was transferred to test tubes containing 10 ml of distilled water. One to two drops of diphenyl carbazide were also added to these test tubes. The optical density of each strain was measured in a spectrophotometer at 540 nm. This optical density determined the chromium content at different temperatures.
Effect of different pH values on chromium reduction
To observe the effect of different pH values on chromium reduction, L-broth was prepared with different pH values (3, 5, 7 and 9) by adding acid and base with different potassium dichromate concentrations (100 µl, 150 µl) and transferred into autoclaved test tubes (5 ml each). These test tubes were labeled properly and inoculated. After inoculation, these tubes were placed in an incubator at 37°C for 24 hrs. After incubation, the culture media was transferred into autoclaved Eppendorf tubes (1.5 ml each). These Eppendorf tubes were centrifuged at 6000 rpm for 15 minutes. After centrifugation, the pellets were settled at the bottom. The supernatant (100 µl) was transferred to test tubes containing 10 ml of distilled water. Then, 1-2 drops of diphenyl carbazide were added to each test tube, and the chromium content was measured under a spectrophotometer at 540 nm.
Effect of different incubation times on chromium reduction
This experiment was performed to determine the best incubation time at which maximum chromium reduction occurs. This experiment was performed for two concentrations (100 µl, 150 µl), and all strains were inoculated into L-broth. These strains were placed in an incubator at 37°C for 24 hrs. After 24 hrs, 2 ml of cultured broth was taken in Eppendorf tubes. The Eppendorf tubes were placed in a centrifuge at 6000 rpm for 10 mins. The pellet was settled at the bottom, while the supernatant was present above. This supernatant (100 µl) was transferred into test tubes containing 10 ml distilled water and 1-2 drops of diphenyl carbazide. The optical density of this solution was measured by a spectrophotometer at 540 nm. The same procedure was performed after 48 hrs and 72 hrs, and O. D was calculated for all strains. Comparison of this O. D was performed to determine the best incubation time.
Comparison of chromium reduction (100 µl, 150 µl) with and without UV at 37°C
Chromium reduction with and without UV exposure was performed to estimate the effects of mutation on chromium reduction. L-Broth was prepared by adding chromium at different concentrations (100 µl, 150 µl) inoculated with strains and exposed to UV for half an hour. After exposure to UV, these test tubes along with the control were incubated at 37°C for 24 hrs. After 24 hrs, the cultured broth (2 ml) was collected in an Eppendorf tube and centrifuged at 6000 rpm for 10 mins. Pellets were settled down while supernatant was present above. The supernatant (100 µl) was transferred into test tubes containing 10 ml distilled water and 2-3 drops of diphenyl carbazide. This solution was then used to determine chromium reduction by using a spectrophotometer at 540 nm. Comparison of both the control and those that were exposed to UV was made to determine chromium reduction.
Comparison of chromium reduction ( 100 µl , 150 µl) at pH 7 with and without UV exposure
Chromium reduction at pH 7 was checked after mutation, and a comparison was made of it with those that were not exposed to UV to check mutation effects on reduction. The pH of the L-broth was maintained at 7. L-broth with different chromium concentrations (100 µl, 150 µl) was inoculated with all chromium strains. A set of controls (not exposed to UV) and a set of tubes exposed to UV was prepared. Tubes were exposed to UV for half an hour. After exposure to UV, these tubes were placed in an incubator for 24 hrs. After 24 hrs, cultured broth was transferred into Eppendorf tubes and placed in a centrifuge at 6000 rpm for 10 mins. The supernatant (100 µl) was transferred to test tubes containing distilled water (10 ml) and 2-3 drops of diphenyl carbonate. This solution was used to determine chromium reduction and to make a comparison by using a spectrophotometer at 540 nm.
Comparison of chromium reduction ( 100 µl, 150 µl ) with and without UV after 48 hrs
Chromium reduction with and without UV exposure was performed to estimate the effects of mutation on chromium reduction after 48 hrs, as maximum reduction was observed after 48 hrs. L-Broth was prepared by adding chromium at different concentrations (100 µl, 150 µl) inoculated with strains. A set of strains with different concentrations (100 µl, 150 µl) were exposed to UV for half an hour. After exposure to UV, these test tubes along with the control were incubated at 37°C for 48 hrs. After 48 hrs, the cultured broth (2 ml) was collected in an Eppendorf tube and centrifuged at 6000 rpm for 10 mins. Pellets were settled down while supernatant was present above. The supernatant (100 µl) was transferred into test tubes containing 10 ml distilled water and 2-3 drops of diphenyl carbazide. This solution was then used to determine chromium reduction by using a spectrophotometer at 540 nm. Comparison of both the control and those that were exposed to UV was made to determine chromium reduction.


RESULTS
Isolation of bacteria
Bacterial strains were isolated from samples of soil and wastewater taken from four different industries, including the Siddique leather industry, Mandiali paper mills, Sitara chemical industry and Riaz textile mills. This strain isolation was performed by using wastewater and soil from different industries as carbon sources (Table 1).
Isolation of these strains was performed against heavy metals such as zinc (Zn) and chromium (Cr) at a concentration of 50 µl. A total of 14 strains were isolated 6 were zinc resistant, and 8 were chromium resistant. Four zinc-resistant strains (S1ZnL1, S2ZnL1, S3ZnL1 and S4ZnL1) were isolated from soil samples from the Siddique leather industry, while the fifth and sixth strains S5ZnL3 and W1ZnL1 were isolated from soil samples from the Sitara chemical industry and wastewater from the Siddique leather industry, respectively, as mentioned in the table. Chromium-resistant strains (S2CrL2 (A), S2CrL2 (B), S4CrL4, S5CrL1) were isolated from soil samples, while W1CrL3 (A), W1CrL3 (B), W4CrL4, W3CrL2 were isolated from wastewater samples of industries (Table 2).
Morphological Characterization
Colonial morphology
The colony morphology of all bacterial strains, including zinc-resistant and chromium-resistant strains, was observed by observing their form, elevation, margin, texture, pigment and opacity. Most zinc-resistant bacterial strains were circular in form except S2ZnL1, which was irregular. Similarly, chromium-resistant bacteria were also circular, except S5CrL1 (Table 3). The size of the bacterial strains varied from small to large. Among the strains isolated, the colony morphology of S1ZnL1, S5ZnL3, W1ZnL1, and S5CrL1 was larger and circular. The pigment of the majority of strains was white to off white or cream, while only S4ZnL1 and W4CrL4 were yellow in color. Similarly, the texture of the strains was shiny and mucoid, while S2CrL2(B) and S5CrL1 had a rough texture (Table 3).
Cellular morphology
The cell morphology of all bacterial strains was observed by certain tests, such as Gram staining, spore staining and motility (Table 4). The shape of the isolated bacterial cells ranged from rods to cocci. Most strains were rod shaped, while S2CrL2 (B), W1CrL3 (A), W1CrL3 (B), S1ZnL1, and S4ZnL1 were coccus, and S4CrL4 and S5ZnL3 were Coccobacilli. The bacteria were gram-positive, except S3ZnL1 and S5CrL1. For spore staining, a three-day-old bacterial culture was used. All strains gave positive results for spore production. To check whether the bacterial strains were motile, a motility test was performed. SIM agar was used to check out motility. All bacterial strains were nonmotile (Table 4).
Biochemical characterization
Catalase test
A catalase test was performed to determine whether metal-resistant bacteria have catalase enzymes. Positive catalase results were observed for all bacterial strains, including zinc resistant, such as S1ZnL1, S2ZnL1, S3ZnL1, S4ZnL1, S5ZnL3, and W1ZnL1, and chromium resistant, such as S2CrL2(A), S2CrL2(B), S4CrL4, S5CrL1, W1CrL3(A), W1CrL3(B), W4CrL4, and W3CrL2, by the production of bubbles of H2O2 on glass slides with bacterial culture (24-48 hours) (Table 5).
Oxidase and indole test
Similarly, an oxidase test was performed to check the presence of oxidase enzyme. Oxidase positive results were observed in all bacterial strains by purple color appearance with tetra methyl-p phenylene diamine oxidase enzyme presence based on blue color appearance. The indole test was performed to check for the presence of the enzyme tryptophanase. All bacterial strains were found to be indole negative because no color change appeared on filter paper (Table 5).
H2S production and starch hydrolysis
The bacterial ability to breakdown sulfur-containing compounds and H2S production was checked by the H2S production test. All bacterial strains were found to be negative, as no black color appeared in test tubes containing SIM agar inoculated with bacterial strains. Positive results for the starch hydrolysis test were observed for some bacterial strains, including S2CrL2(B), S5CrL1, S5CrL1, S4ZnL1, S5ZnL3, W1ZnL1, and S3ZnL1, due to the appearance of a clear zone around the bacterial culture, while other bacterial strains were negative, as no clear zone appeared around the bacterial culture (Table 5).
Heavy metal resistance profiling
All bacterial strains, including zinc- and chromium-resistant strains, were checked for cross-metal resistance, including zinc chloride (ZnCl2), potassium dichromate (K2CrO4), nickel chloride (NiCl2), cobalt chloride (CoCl2), sodium selenite (Na2SeO3), silver chloride (SiCl2) and manganese chloride (MnCl2), at different concentrations (100 µl, 150 µl, 200 µl, 300 µl).
All bacterial strains were resistant to zinc (Zn), manganese (Mn), selenium (Se) and nickel (Ni). In the case of chromium (Cr), cobalt and silver, some strains were sensitive. S3ZnL1 was sensitive to chromium, while W1CrL3 (A) and S5CrL1 were sensitive to cobalt. All strains were sensitive to silver (Si) except S4ZnL1, W1ZnL1, W1CrL3 (B) and S5CrL1. Most of the strains were resistant at 100 µl and 150 µl to all metals except silver (Si). Most strains were sensitive to all metals except nickel (Ni) and selenium (Se) at concentrations of 200 µl and 300 µl, respectively. All strains were resistant to nickel (Ni) and manganese (Mn) at all concentrations (Table 6, Table 7, Table 8, Table 9). Among the strains, S4ZnL1, W1ZnL1, and S5CrL1 were resistant to various metals exploited at 100 µl concentration. The resistivity decreased with increasing concentration. Only S4ZnL1 was resistant against all metals at 150 and 200 µl concentrations.
Growth curve
Growth of all bacterial strains was observed after time intervals of 2, 4, 6, 18, 24, and 48 hours by measuring the optical density (O.D.). No growth was observed after 2 hours. Growth started increasing after 4 hours of incubation. After 6 to 18 hrs, growth increased sharply. After that, growth stopped increasing, and the stationary phase started when there was no appreciable increase in growth. After 48 hours, no further increase in growth was observed. Maximum growth was observed in the S1ZnL1, S2CrL2 (A), W4CrL4 and W3CrL2 strains (2.000, 2.100, 2.213, and 2.221, respectively) after 48 hours (Table 10).
Effect of pH on growth
The growth of bacterial strains was observed at different pH values, including 3, 5, and 9, to determine which environmental conditions, either acidic or basic, are suitable for their survival and maximum growth. The growth of bacterial strains was observed by taking the optical density of cultured broth from a spectrophotometer at 600 nm. The graph was plotted between different pH values and bacterial strains, which showed that maximum growth of zinc- and chromium-resistant bacterial strains was observed at pH 5, except for some strains, such as W1ZnL1, whose growth was greater (1.100) under alkaline conditions (pH 9). The growth at pH 3 was lower, while at pH 9, growth was enhanced (Table 11).
Growth at different temperatures
Growth at different temperatures (27°C, 37°C, 20°C, 42°C) was observed to determine the optimum temperature for bacterial growth. Optical density was calculated with the help of a spectrophotometer at 600 nm. The optimum temperature for bacterial growth was 37°C. Bacterial strains showed maximum growth at 37°C compared with 27°C, 20°C and 42°C. Minimum growth was observed at 20°C (Table 12). The maximum growth was detected in the W4CrL4 strain (1.848), followed by W3CrL2 (1.694).
Growth at different incubation times
The growth of all strains was checked after different incubation times (24 hrs, 48 hrs, 72 hrs) by calculating the optical density from a spectrophotometer of cultured broth. Much growth was observed after 72 hours compared to 24 and 48 hours (Table 13). The growth of the strain increased with increasing incubation time, and maximum growth was achieved by the W4CrL4 strain (2.120) after 72 hours, followed by W3CrL2 (1.910).
CHROMIUM REDUCTION TESTS
Chromium reduction at different temperatures
Chromium reduction with different concentrations (100 µl, 150 µl) at different temperatures (37°C, 27°C, 25°C) was checked by using diphenyl carbazide as an indicator for chromium reduction. This experiment was performed to estimate the optimum temperature for chromium reduction at which maximum reduction occurs. Maximum reduction was observed at 37°C, as determined by the optical density calculated by a spectrophotometer at both concentrations. The reduction at a higher concentration (150 µl) was less than that at 100 µl. The reduction at 27°C was greater than the reduction at 25°C. The maximum chromium reduction was reported by the W3CrL2 strain (93% reduction) when exposed to 100 µl of chromium at 37°C, followed by S4CrL4 and W4CrL4 (90%). The % reduction was reduced to 83% when strains (W4CrL4) were exposed to higher concentrations (150 µl) (Table 14, Table 15)
Chromium reduction at different pH values
Chromium reduction with different concentrations (100 µl, 150 µl) at different pH values (5, 7, 9) was also checked by using diphenyl carbazide as an indicator for chromium reduction. This experiment was performed to estimate the optimum pH for chromium reduction at which maximum reduction occurs. W1CrL3(A), S4CrL4, W4CrL4, and S5CrL1 showed maximum reduction at pH 7 (93%, 91%, 88% and 87%, respectively) when exposed to 100 µl, as determined by the optical density. For some strains, such as S2CrL2(A) and W1CrL3(B), the reduction was maximum at pH 5 (Table 16). At a higher concentration of chromium (150 µl), the reduction potential of bacterial strains was reduced even at neutral pH (7). Maximum reduction at higher concentrations was detected in S4CrL4 and W1CrL3(A) (Table 17).
Chromium degradation at different incubation times
The chromium reduction potential of the bacterial strains was analyzed with different concentrations (100 µl, 150 µl) at different incubation times (24 hrs, 48 hrs, 72 hrs) by using diphenyl carbazide as an indicator for chromium reduction. The maximum chromium reduction potential of the strains was observed after 72 hrs of incubation at 37°C when exposed to 100 µl of chromium. Maximum reduction was detected in W3CrL2 (93%), determined as the optical density by spectrophotometer. A similar strain also showed maximum reduction even at a higher concentration of chromium (150 µl) (Table 18, Table 19).
Chromium reduction after UV exposure under different environmental conditions
Chromium reduction at 37°C
Comparison of chromium reduction (100 µl, 150 µl) with and without exposure to ultraviolet light (UV) was checked in this experiment. Reduction was checked after half an hour of exposure of inoculated broth to UV and was compared to inoculated broth without exposure to UV after 24 hrs of incubation at 37°C. Chromium reduction was interestingly increased with UV exposure compared to those that were not exposed to UV at both concentrations in all strains except S2CrL2 (A). Reduction of chromium after UV exposure showed that mutation occurring in strains has a positive effect, except in the case of S2CrL2 (A), as it exerted a negative effect on reduction potential. With UV exposure, the reduction was increased by 56% to 95% in S4CrL4, followed by W4CrL4, W1CrL3(B) and S5CrL1 (Table 20). Similarly, the chromium reduction potential of W1CrL3(A) was elevated from 65% to 97% even at 150 µl of chromium (Table 21).
Chromium reduction after 48 hrs
Chromium reduction was greater after exposure to UV light than after exposure to UV at both concentrations (100 µl, 150 µl) due to mutation, which had a positive effect. In some strains, mutation negatively affected chromium (100 µl) reduction. The chromium reducing capability of S2CrL2(A) was adversely affected by UV light (91% to 24%). The maximum reduction results were revealed by S5CrL1 (12% to 89%) at 100 µl of chromium when exposed to UV light (Table 22). At higher levels of heavy metals, the maximum % reducing ability was shown by the S2CrL2(A) and S4CrL4 strains (Table 23).
Chromium reduction at pH 7
Under an optimum neutral pH, UV light increased the chromium reduction ability of the bacterial strains. Maximum chromium reduction at 100 µl after UV exposure was revealed by S5CrL1, S4CrL4, and W1CrL3(B) (96, 93 and 92%, respectively). Among all bacterial strains, the metal reducing ability of S2CrL2(A) was significantly affected by UV light (Table 24). UV light exposure dramatically enhanced the metal reducing potential of S2CrL2(A) when treated with 150 µl of metal. At higher concentrations, under UV light, the highest chromium reduction was displayed by S4CrL4, S2CrL2(A), and W1CrL3(B) (95, 93 and 91%, respectively) (Table 25).
DISCUSSION
Different industries, such as paper, leather, textile and other industries, release different hazardous, toxic and harmful substances and heavy metals through wastewater 1. Waste water containing hazardous and harmful substances enters drinking water and contaminates it, and if water contaminated with these substances is applied to food crops in fields, it enters crops by water uptake. This contaminated food ingestion may result in different harmful effects on human health 23. Heavy metals are abundant in wastewater, such as chromium, selenium, zinc, and cobalt. Different chemical and biological methods are used for the remediation of heavy metals. In bioremediation, microbes are used to convert toxic chemicals into less toxic or nontoxic forms. Microbes have certain enzymes that help to convert toxic chemicals into nontoxic forms 24.
Heavy metal-resistant bacteria can be isolated from polluted water and soil. In the current study, different bacterial strains were initially isolated by pouring dilute samples of soil and wastewater from Siddique leather works, Mandiali paper mills, the Sitara chemical industry and Riaz textile mills (Table 1). They were isolated on media containing 50 µl of salts such as zinc (ZnCl2) and chromium (K2CrO4). Different colonies were picked and then streaked on L-agar plates. The bacteria selected from these plates were resistant to these metals. These bacteria, such as S1ZnL1, S2ZnL1, S3ZnL1, S4ZnL1, S5ZnL3 and W1ZnL1, were zinc-resistant bacteria, while S2CrL2 (A), S2CrL2 (B), W1CrL3 (A), W1CrL3 (B), S4CrL4, W4CrL4, W3CrL2 and S5CrL1 were chromium-resistant bacteria (Table 2). They were isolated and purified at 37°C after 24 hrs of incubation. Colonies were picked on the basis of their difference in appearance. Colony morphology of fresh cultures of these strains was observed. All strains were off white and white in the case of zinc, while some strains were yellowish and transparent in the case of chromium-resistant strains. Gram staining determined that most bacteria were gram-positive except some S3ZnL1 and S5CrL1, which were gram-negative. Previous studies have shown that gram-positive bacteria are more resistant to gram-negative bacteria. All strains were rod, coccobacillus and cocci (Table 3, Table 4).
Spore staining of these strains was performed after 7 days of incubation to determine spore formation. All bacterial strains showed positive results for spore staining. The motility of all strains was also observed. All strains found to be nonmotile exhibited growth in a straight line in SIM agar. Different biochemical tests were performed for bacterial identification, such as catalase and oxidase tests, to check for the presence of catalase and oxidase enzymes. All strains gave positive results for catalase and oxidase by producing bubbles upon reaction with hydrogen peroxide (H2O2) and by dark blue color production upon reaction with reagent (Table 5). A starch hydrolysis test was also performed to check the production of amylase enzyme by bacteria to produce sugar. Media consisted of starch, and the reaction with iodine after incubation showed a clear zone in the case of S2CrL2 (B), S5CrL1, S5CrL1, S4ZnL1, S5ZnL3, W1ZnL1, and S3ZnL1. Starch was consumed by bacteria producing the enzyme amylase and converted into mono- and disaccharides. This sugar was catabolized in cells. The positive results for starch hydrolysis indicated that they are Bacillus strains. Others did not show positive results for starch hydrolysis due to the absence of amylase enzyme (Table 5). An H2S production test was performed to determine the production of H2S by bacteria by the decomposition of sulfur-containing amino acids. This test differentiates between bacteroid . and Brucella 25. It is used for the identification of bacteria belonging to the family Enterobacteriaceae 26. All bacterial strains, including Zn- and Cr-resistant strains, showed negative results. A Simon citrate biochemical test was used to identify bacteria using citrate as a carbon source and lyses citrate into alkaline carbonate and bicarbonate. S2CrL2 (B), S5CrL1, S5CrL1, S4ZnL1, S5ZnL3, W1ZnL1, W1CrL3 (B), W1CrL3 (A), W4CrL4, and S4CrL4 showed a change in color from green to orange, while the others showed no change in color. Change in color to orange identifies bacteria belonging to Serratia marcescens and Enterobactor. Negative results showed by bacteria identified that bacteria are Escherichia coli. All strains gave negative results for the indole test because of the absence of the enzyme typtophenase. No pink color appeared on filter paper, showing negative results.
Heavy metal resistance profiling was performed against different metals, such as COCl2, SiCl2, MnSO4, Na2SiO3, NiCl2, ZnSO4 and K2CrO4, at different concentrations. These strains showed resistance to a wide range of heavy metals. In a previous study, Samnata et al. (2017) isolated strains from wastewater that were resistant to high concentrations of heavy metals such as cadmium, chromium, nickel and cobalt27. The concentrations of these heavy metals were 50 µl, 100 µl, 150 µl, 200 µl, 250 µl and 300 µl. The resistance of heavy metals was checked by making a 1% solution of these metals. The required concentration of heavy metal was then added to L-agar media from a stock solution of metal. Strains were resistant to all metals at 50 µl and 100 µl concentrations of almost all metals. Some strains became sensitive to 150 µl of certain metals. Cr strains were resistant to zinc metal up to a concentration of 300 µl, except for some strains, such as S2CrL2 (B), W1CrL3 (A), W1CrL3 (B), S4CrL4, W3CrL2, and S5CrL1. All zinc strains were resistant to chromium up to a concentration of 300 µl except W1ZnL1. Strains including chromium-resistant and zinc-resistant strains were also resistant to higher concentrations of cobalt (300 µl), except a few of them were sensitive, such as S5ZnL1, W1CrL3(A), W1CrL3(B), S4CrL4, and S5CrL1. All strains were resistant to higher concentrations of manganese and selenium, but in the case of silver, only S4ZnL1, W1ZnL1, S5CrL1 and S4CrL4 were able to survive at higher concentrations of nickel (Table 6, Table 7, Table 8, Table 9).
Previous studies determined that heavy metal-resistant bacteria isolated from municipal wastewater showed maximum growth at temperature (30-40°C and pH 6-9)5, 27. In the current research, growth was observed at different incubation times (24 hrs, 48 hrs, 72 hrs) by inoculating strains with a sterilized loop at 37°C. The optical density of all strains was measured after different times. Maximum growth was observed after 72 hrs. The growth rate of bacteria was checked by calculating its optical density after 2, 4, 6, 18, 24, 48 h. Different phases of bacterial life were observed by plotting a graph between time and bacterial cells. Different strains showed different growth patterns, including their lag, log, stationary decline and death phases. Cultural conditions were constant for all, i.e., pH 7 and temperature 37°C. Some strains showed a rapid increase in growth compared with others, such as S4ZnL4, W1ZnL1, S2CrL2 (A), S4CrL4, W4CrL4, W3CrL2, and S5CrL1. The growth of all strains increased (Table 10, Table 11, Table 12, Table 13).
Hexavalent chromium reduction to less toxic trivalent chromium is an important environmental concern due to its mobility and toxicity 28, 29, 30. Chromium reduction of chromium strains with different Cr salt concentrations (100 µl, 150 µl) was observed using diphenyl carbazide as an indicator. Cultured broth along with the required salt concentration was centrifuged, and then the supernatant was used to make a solution with distilled water along with an indicator to determine chromium reduction by measuring the optical density. Cr reduction was observed at different temperatures (27°C, 42°C, and 37°C), pH values (5, 7, and 9) and incubation times (24 hrs, 48 hrs, and 72 hrs). The optical density of the solution determined the level of chromium reduction. % chromium reduction was maximum at 37°C when observed at different temperatures at 100 µl compared to 150 µl. Previous studies have shown that bacteria decrease with increasing concentrations of chromium 31. Therefore, fewer bacteria are available to reduce chromium. In the present study, some bacteria showed greater potential to reduce chromium even at higher concentrations (150 µl), such as W4CrL4. The reduction at room temperature was less due to less growth of bacteria than at other temperatures due to less microbial activity. Some strains reduced chromium at concentrations of 100 µl up to 93% at 37°C, such as W3CrL2, while it showed 74% reduction at 150 µl at 37°C. Maximum reduction was observed at 37°C compared to other temperatures at 150 µl (Table 14, Table 15, Table 16, Table 17, Table 18, Table 19). A study conducted by Faisal et al.32 showed that some bacterial strains showed maximum reduction at pH 7. Similarly, it was also reported that some bacterial strains showed maximum reduction of chromium under acidic conditions (pH 5) 33. In the case of some strains, alkaline conditions are favorable for reduction at both concentrations. In the present research, reduction at different incubation times at different concentrations (100 µl, 150 µl) was observed and found to be greater after 72 hrs of incubation at 37°C by all strains, including chromium- and zinc-resistant strains. After 72 hrs, growth was greater than that after a shorter incubation time. Maximum bacteria are present to reduce the maximum amount of chromium. W3CrL2 showed greater potential to reduce chromium at 100 µl, while S2CrL2 showed the potential to reduce chromium up to 94% at cobalt chloride, manganese chloride, nickel chloride, dipotassium chromate, and zinc chloride concentrations after 72 hrs of incubation. Shakoori et al.34 conducted a study on hexavalent (VI) chromium reduction by bacterial strains isolated from different tannery effluents. These strains were used for hexavalent chromium reduction with different chromium concentrations from 50 to 350 mgL-1 at different incubation times. These strains showed 87% chromium reduction after 72 hrs34. Another study was conducted on hexavalent chromium reduction by bacterial isolates that were isolated from dichromate-contaminated industrial soil. Bacterial strains showed a greater potential for hexavalent chromium reduction at 30°C and pH (7-10) after 72 hrs 35.
The effect of DNA mutation was checked by exposing inoculated L-broth to UV for half an hour. This broth was incubated at different temperatures for 24 hrs. The cultured broth was centrifuged to obtain the supernatant. This supernatant was then used to determine chromium reduction. The optical density of all controls (without UV exposure) exposed to UV was calculated from a spectrophotometer at 540 nm. A comparison was made between both. DNA mutation after exposure to UV radiation resulted in a change in the percentage of chromium reduction at different concentrations. At a lower concentration of 100 µl, the reduction was found to be more similar to that at a higher concentration (150 µl) (Table 20, Table 21, Table 22, Table 23, Table 24, Table 25). As the salt concentration increased, most of the bacteria were unable to survive in the saline environment. Mutations can be induced by different physical and chemical methods. Ultraviolet radiation is a physical method to induce mutation by forming pyrimidine dimerization and cross links 36. This mutation is introduced for better results of bioremediation of toxic compounds as well as of heavy metals37.
Conclusion
Heavy metal contamination has massive environmental and economic consequences on soils and water, causing changes that can disrupt the nutrient cycle, impede nutrient uptake by plant roots, and reduce agricultural output. Vegetation, soil fertility, and soil-borne microbes are all severely harmed as a result of this contamination. Heavy metals infiltrate food systems and have an impact on living creatures owing to their nonbiodegradable nature. When we eat foods containing heavy metals, they enter our bodies, affecting our bodily functioning and causing disorders. Bioremediation is an environmentally friendly and cost-effective way to reduce heavy metals present in our water compared to synthetic treatments. In the current study, the bacterial strains isolated from industrial wastes and soils showed significant resistivity against various concentrations of Zn and Cr and reduced it efficiently under different conditions (pH, incubation time, temperature and UV light). The stated efficacy of indigenous bacteria in the remediation process may be enhanced and used for in situ bioremediation standardization and biodegradation protocol development. The far-reaching advantages might result in efficient contaminated soil and water restoration.
Conflict of interest
The authors of the article declare no competing interests.
Acknowledgment
The authors of the current study are thankful to the Siddique leather works, Mandiali paper mills, Sitara chemical industry and Riaz textile mills for providing research samples. The authors are also thankful to the Department of Chemistry, University of Management and Technology (UMT), Lahore, Pakistan for providing research facilities, and the team of Big Bio for statistical analysis and their support throughout the study.
Funding
The current study was not funded by any funding agency.
References
-
Ajiboye TO, Oyewo OA, Onwudiwe DC. Simultaneous removal of organics and heavy metals from industrial wastewater: A review. Chemosphere. 2021;262:128379.
.
PubMed Google Scholar -
Ubando AT, Africa ADM, Maniquiz-Redillas MC, Culaba AB, Chen W-H, Chang J-S. Microalgal biosorption of heavy metals: A comprehensive bibliometric review. Journal of Hazardous Materials. 2021;402:123431.
.
PubMed Google Scholar -
Kumari S, Mishra A. Heavy Metal Contamination. Soil Contamination: IntechOpen; 2021.
.
-
Saravanan A, Jeevanantham S, Jayasree R, Hemavathy R, Kumar PS, Yaashikaa P. Environmental and health effects of nanomaterials. Nanomaterials: Elsevier; 2021. p. 701-11.
.
-
Soliman N, Moustafa A. Industrial solid waste for heavy metals adsorption features and challenges; a review. Journal of Materials Research and Technology. 2020;9(5):10235-53.
.
-
Gao X, Liu Z, Li J, Wang X, Cui L, Ai S, et al. Ecological and health risk assessment of perfluorooctane sulfonate in surface and drinking water resources in China. Science of the Total Environment. 2020;738:139914.
.
PubMed Google Scholar -
Kazmi A, Usman M, Muhammad W. Effect of Hydroxybenzoic Acid Foliar Spray on Selected Wheat Varieties under Induced Heavy Metal Stress. Global Journal of Research and Review. 2019;6:1-4.
.
-
Rehman AU, Nazir S, Irshad R, Tahir K, ur Rehman K, Islam RU, et al. Toxicity of heavy metals in plants and animals and their uptake by magnetic iron oxide nanoparticles. Journal of Molecular Liquids. 2021;321:114455.
.
-
Kaur R, Sharma S, Kaur H. Heavy metals toxicity and the environment. Journal of Pharmacognosy and Phytochemistry, SP1. 2019:247-9.
.
-
Bortone I, Erto A, Di Nardo A, Santonastaso GF, Chianese S, Musmarra D. Pump-and-treat configurations with vertical and horizontal wells to remediate an aquifer contaminated by hexavalent chromium. Journal of Contaminant Hydrology. 2020;235:103725.
.
PubMed Google Scholar -
Liu W, Li J, Zheng J, Song Y, Shi Z, Lin Z, et al. Different pathways for Cr (III) Oxidation: implications for Cr (VI) reoccurrence in reduced chromite ore processing residue. Environmental Science & Technology. 2020;54(19):11971-9.
.
PubMed Google Scholar -
Sandeep G, Vijayalatha K, Anitha T. Heavy metals and its impact in vegetable crops. Int J Chem Stud. 2019;7(1):1612-21.
.
-
Wakeel A, Xu M. Chromium morpho-phytotoxicity. Plants. 2020;9(5):564.
.
PubMed Google Scholar -
Hafiz MF, Ma L. Effect of chromium on seed germination, early seedling growth and chromium accumulation in tomato genotypes. Acta Physiologiae Plantarum. 2021;43(7):1-11.
.
-
Mathur S, Kalaji H, Jajoo A. Investigation of deleterious effects of chromium phytotoxicity and photosynthesis in wheat plant. Photosynthetica. 2016;54(2):185-92.
.
-
Teklay A. Physiological effect of chromium exposure: A review. Int J Food Sci Nutr Diet S. 2016;7:1-11.
.
-
Chandra AK, Chatterjee A, Ghosh R, Sarkar M. Effect of curcumin on chromium-induced oxidative damage in male reproductive system. Environmental Toxicology and Pharmacology. 2007;24(2):160-6.
.
PubMed Google Scholar -
Younan S, Sakita GZ, Albuquerque TR, Keller R, Bremer‐Neto H. Chromium (VI) bioremediation by probiotics. Journal of the Science of Food and Agriculture. 2016;96(12):3977-82.
.
PubMed Google Scholar -
Wilbur S, Abadin H, Fay M, Yu D, Tencza B, Ingerman L, et al. Toxicological profile for chromium. 2012.
.
-
Yoshihisa Y, Shimizu T. Metal allergy and systemic contact dermatitis: an overview. Dermatology research and practice. 2012;2012.
.
PubMed Google Scholar -
Achmad RT, Auerkari EI. Effects of chromium on human body. Annual Research & Review in Biology. 2017:1-8.
.
-
DesMarias TL, Costa M. Mechanisms of chromium-induced toxicity. Current opinion in toxicology. 2019;14:1-7.
.
PubMed Google Scholar -
Alengebawy A, Abdelkhalek ST, Qureshi SR, Wang M-Q. Heavy metals and pesticides toxicity in agricultural soil and plants: Ecological risks and human health implications. Toxics. 2021;9(3):42.
.
PubMed Google Scholar -
Sharma P, Pandey AK, Kim S-H, Singh SP, Chaturvedi P, Varjani S. Critical review on microbial community during in-situ bioremediation of heavy metals from industrial wastewater. Environmental Technology & Innovation. 2021:101826.
.
-
McMahan L, Grunden AM, Devine AA, Sobsey MD. Evaluation of a quantitative H2S MPN test for fecal microbes analysis of water using biochemical and molecular identification. Water Research. 2012;46(6):1693-704.
.
PubMed Google Scholar -
Morales-López S, Yepes JA, Prada-Herrera JC, Torres-Jiménez A. Enterobacteria in the 21st century: a review focused on taxonomic changes. The Journal of Infection in Developing Countries. 2019;13(04):265-73.
.
PubMed Google Scholar -
Samanta A, Bera P, Khatun M, Sinha C, Pal P, Lalee A, et al. An investigation on heavy metal tolerance and antibiotic resistance properties of bacterial strain Bacillus sp. isolated from municipal waste. Journal of Microbiology and Biotechnology Research. 2012;2(1):178-89.
.
-
Guo S, Xiao C, Zhou N, Chi R. Speciation, toxicity, microbial remediation and phytoremediation of soil chromium contamination. Environmental Chemistry Letters. 2021;19(2):1413-31.
.
-
Deb AK, Biswas B, Naidu R, Rahman MM. Mechanistic insights of hexavalent chromium remediation by halloysite-supported copper nanoclusters. Journal of Hazardous Materials. 2022;421:126812.
.
PubMed Google Scholar -
Upadhyay S, Sinha A. A Study on Different Bioremediation Approaches to Hexavalent Chromium. Pollution Control Technologies: Springer; 2021. p. 57-74.
.
-
Chakraborty R, Woo H, Dehal P, Walker R, Zemla M, Auer M, et al. Complete genome sequence of Pseudomonas stutzeri strain RCH2 isolated from a Hexavalent Chromium [Cr (VI)] contaminated site. Standards in genomic sciences. 2017;12(1):1-9.
.
PubMed Google Scholar -
Faisal M, Hasnain S. Microbial conversion of Cr (VI) in to Cr (III) in industrial effluent. African Journal of Biotechnology. 2004;3(11):610-7.
.
-
Yin R, Ling L, Xiang Y, Yang Y, Bokare AD, Shang C. Enhanced photocatalytic reduction of chromium (VI) by Cu-doped TiO2 under UV-A irradiation. Separation and Purification Technology. 2018;190:53-9.
.
-
Shakoori A, Makhdoom M, Haq R. Hexavalent chromium reduction by a dichromate-resistant gram-positive bacterium isolated from effluents of tanneries. Applied microbiology and biotechnology. 2000;53(3):348-51.
.
PubMed Google Scholar -
Camargo F, Bento F, Okeke B, Frankenberger W. Chromate reduction by chromium‐resistant bacteria isolated from soils contaminated with dichromate. Journal of Environmental Quality. 2003;32(4):1228-33.
.
PubMed Google Scholar -
Kim S-I, Pfeifer GP. The epigenetic DNA modification 5-carboxylcytosine promotes high levels of cyclobutane pyrimidine dimer formation upon UVB irradiation. Genome Instability & Disease. 2021;2(1):59-69.
.
PubMed Google Scholar -
Mao Z, Yu C, Xin L. Enhancement of phenol biodegradation by Pseudochrobactrum sp. through ultraviolet-induced mutation. International journal of molecular sciences. 2015;16(4):7320-33.
.
PubMed Google Scholar
Comments
Article Details
Volume & Issue : Vol 8 No 1 (2022)
Page No.: Article ID 787
Published on: 2022-03-31
Citations
Copyrights & License
This work is licensed under a Creative Commons Attribution 4.0 International License.
Search Panel
Pubmed
Google Scholar
Pubmed
Google Scholar
Pubmed
Google Scholar
Pubmed
Google Scholar
Pubmed
Google Scholar
Pubmed
Google Scholar
Pubmed
Search for this article in:
Google Scholar
Researchgate
- HTML viewed - 3574 times
- PDF downloaded - 904 times
- XML downloaded - 66 times
